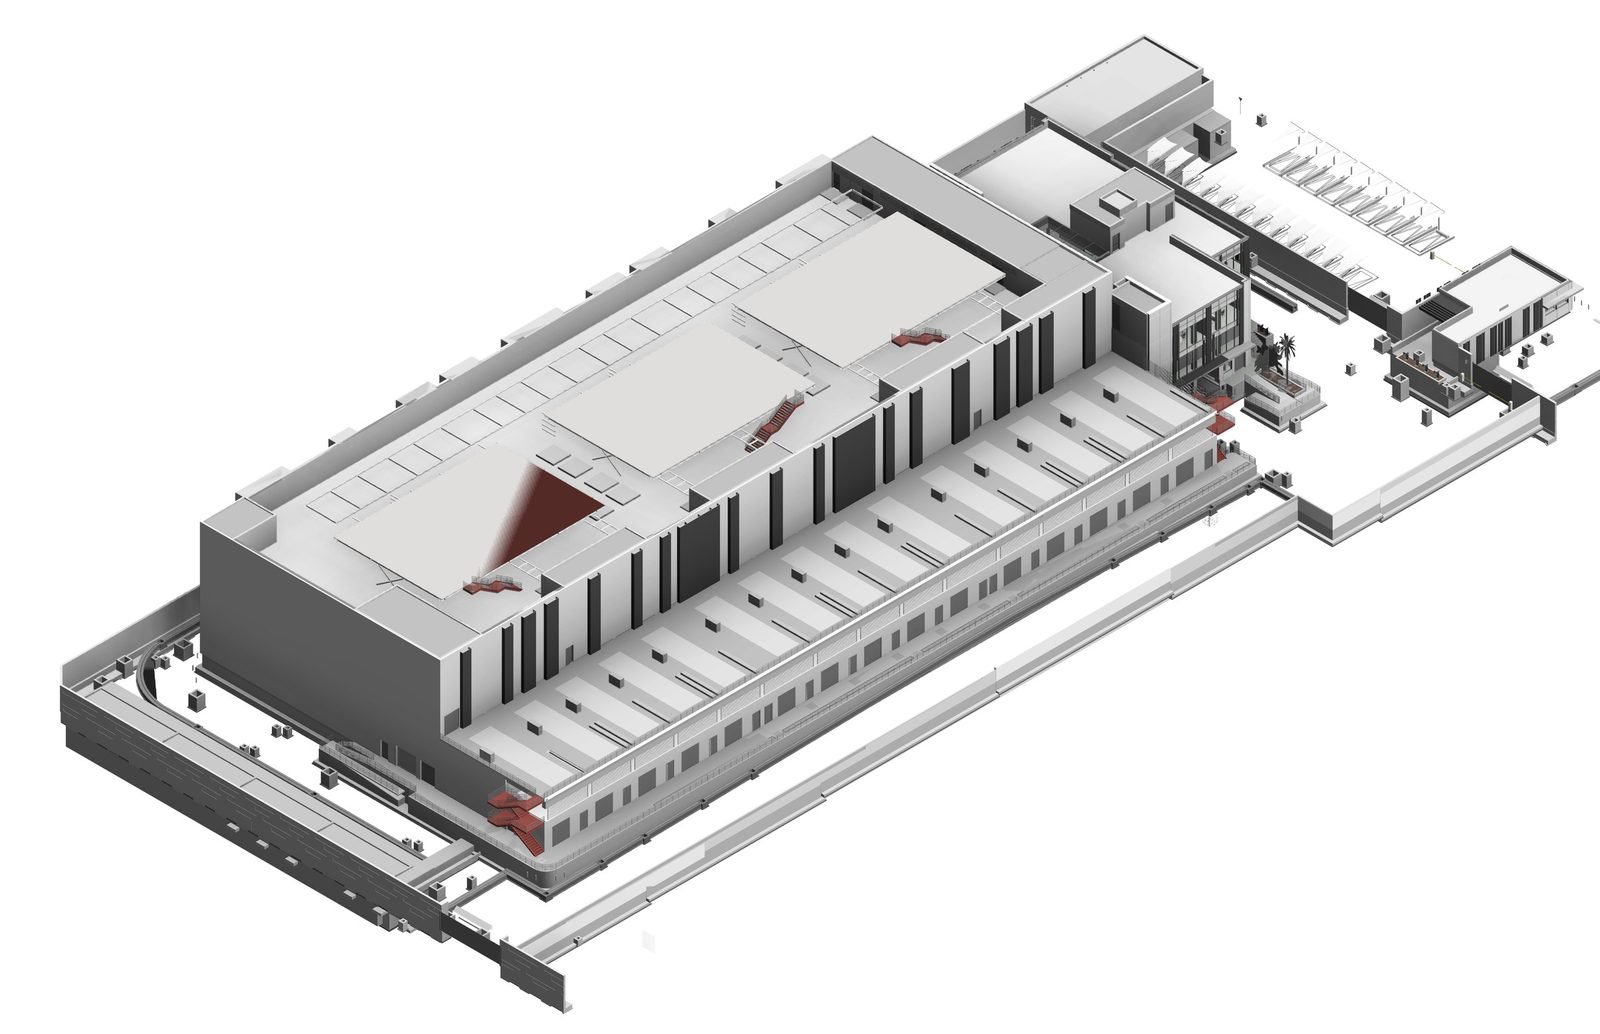

Under LEED v5, every Building Design and Construction project has to quantify the embodied carbon of its structure, enclosure and hardscape. It is a prerequisite, not a credit, and on a typical Saudi building the structure (concrete and reinforcing steel above all) is most of the answer. The arithmetic is simple. What makes the number useful is where the quantities come from and which EPD sits behind each line.
What is counted, and what is not
EN 15978 divides a building's life into modules: the product stage (A1 raw material supply, A2 transport to the plant, A3 manufacturing), the construction process (A4–A5), the use stage (B1–B7), end of life (C1–C4), and benefits beyond the system boundary (D). The two LEED v5 requirements draw different boundaries on that strip.

| MRp2: Quantify and Assess Embodied Carbon | MRc2: Reduce Embodied Carbon, Option 1 | |
|---|---|---|
| Status | Prerequisite, every BD+C project | Credit, up to 6 points for New Construction |
| Stages | A1–A3, cradle to gate | A to C, D optional; operating energy and water excluded |
| Scope | Structure, enclosure and hardscape: concrete, steel, masonry, insulation, aluminium, wood, cladding, glass, asphalt | The whole building, against a baseline of similar size, function, construction and location |
| Period | — | At least 60 years |
| Output | The total, the three largest sources and the strategies considered for them | 2 points at the baseline; 3, 4, 5 and 6 points at 10, 20, 30 and 40 percent below it |
The quantities come from the model
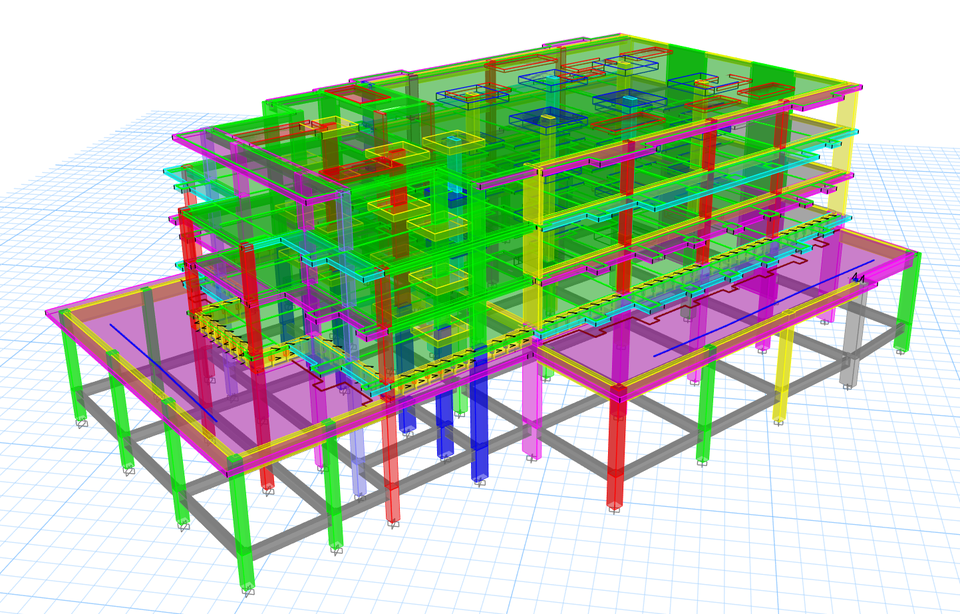
An embodied-carbon figure is a quantity take-off multiplied by emission factors. The factors get the attention; the take-off decides whether the number is right. Concrete by strength class, reinforcement by tonnage, structural steel by section type and plate, blockwork by area, taken from the coordinated structural and architectural models rather than from rates per square metre. When the design changes, the take-off changes with it, and the MRp2 figure stays current instead of describing a scheme that no longer exists.
The factor comes from an EPD, and the EPD matters
An Environmental Product Declaration reports a product's impacts under ISO 14025, using the rules of ISO 21930 or EN 15804+A2. MRp2 prefers product-specific EPDs. Industry averages are a starting point, but for the two materials that dominate a Saudi structure, the production route moves the answer by more than any design change will.
| Material | What moves the factor | Example |
|---|---|---|
| Reinforcing bar | The steelmaking route | Two Saudi producers' EPDs give 0.90 t CO₂e per tonne for scrap-based electric arc furnace bar and 2.24 t for bar from the direct reduced iron route: about 2.5 times |
| Ready-mixed concrete | Strength class and the share of fly ash or slag replacing cement | The NRMCA industry averages classify each mix by specified strength and supplementary cementitious content |
| Structural steel | Section, plate or hollow section, and the mill | Industry averages by product type until the mill's own EPD is known |

A workable sequence
- Take quantities from the coordinated models at each design stage, by material and by strength or product type.
- Assign each line an EPD (industry average at concept, the producer's own once the supplier is known) and record the EPD's number and validity.
- Rank the lines. The top three are the MRp2 hotspots; write the strategy considered for each.
- Test alternatives on those three lines (another mix, another source) and keep the reduction as evidence for MRc2 or for the next stage.
- Repeat at each stage. A figure calculated once at concept describes a building that will not be built.
Our embodied carbon calculator does this for the structure: A1–A3 from named EPDs, the total and the intensity per square metre, the three hotspots and the saving of an alternative on each line. The quantities come from the models our structural design and LEED teams share.
Frequently asked questions
Does MRp2 require product-specific EPDs?
It prefers them. Industry averages are accepted where the product is not yet known, and the summary should say which lines rely on averages.
Why only A1–A3 for the prerequisite?
Because the product stage is what EPDs report consistently and what a design team can act on through specification. The whole life cycle belongs to the whole-building assessment in MRc2.
Is the rebar difference real or an artefact of the EPDs?
It reflects the routes. Scrap-based electric arc furnace steel starts from recycled metal; the direct reduced iron route starts from ore, which has to be reduced before it is melted. Both EPDs report A1–A3 per tonne of bar, and most of the gap comes from that difference in raw material.